Your response rate shows how many people have completed surveys compared to how many were invited. It gives you a clear picture of participation and helps you spot groups that may need extra follow‑up.
Tip! Looking for tips to increase your survey’s response rate? See How to boost your survey’s response rate.
In My Effectory, you can track response rates per project and per survey. Both views follow the same structure, making it easy to compare and understand participation.
Response per project
To view a project's response rate, firstly find it in Surveys > Projects. At the top of the page you will see the project’s overall response rate. Select View response for the full overview.
Access:
- Only central coordinators and project coordinators can view full response data for both projects and surveys.
What the project response shows
At the top of the page, you will see the same overview shown in the project page. This includes:
-
Project response rate: The combined participation across all surveys in the project, expressed as a percentage.
-
Benchmark comparison (if enabled): This shows how your organisation’s response rate compares to the average response rate of similar organisations in the same benchmark
-
Group participation: The number of surveys each group has taken part in
The bottom section of the page shows the Response per group breakdown, based on the currently selected reporting structure. Each group row shows:
-
Surveys: How many surveys the group was included in
-
Response: The combined response percentage across those surveys
-
Participants: The number of respondents compared to invited participants
How project response is calculated:
If, for example, your project contains three surveys with a total of 500 invited participants and 350 completed responses, the project response rate is 350 ÷ 500 = 70%. In this calculation, employees may be counted more than once if they were invited to multiple surveys.
Tools you can use
At the top of the table, you can:
-
Switch between reporting structures (only structures used for inviting appear)
-
Search for groups using the search bar
-
Filter by response ranges
-
Export the overview to Excel
Response per survey
To view the response of a survey, find it in Surveys > All surveys or from the project page and open it. Select View response to open the detailed view.
You can do this for both completed surveys and surveys that are still running. While a survey is live, the response overview updates every 30 minutes. This lets you follow participation as it comes in, see whether reminders are having an effect, and spot groups that may need extra attention.
Access:
-
Central coordinators and project coordinators can view full response data for both projects and surveys.
-
Local coordinators and results access coordinators only see response data per survey, and only for the groups they are linked to.
What the survey response shows
Each row in the table displays the total respondents vs invited participants for that specific survey, grouped according to the inviting structure.
How survey response is calculated:
If, for example, 120 people are invited to a survey and 90 respond, the response rate is 90 ÷ 120 = 75%.
Tools you can use
You can:
-
View the response rate for the inviting structure
-
Search for groups using the search bar
-
Filter by response ranges
-
Export the overview to Excel
Follow the response rate of an ongoing survey
Survey response rates update every 30 minutes while a survey is live.
How reporting structures influence response rates
Your organisation’s reporting structures determine how groups appear on the response pages. Each structure gives you a different way to break down participation. If something looks off in your response overview, such as unexpected group sizes or missing teams, ask a central or project coordinator to check the underlying employee data.
If your project uses more than one structure, you can switch between them on the response page. Only structures used to invite participants are shown.
Share your response rate
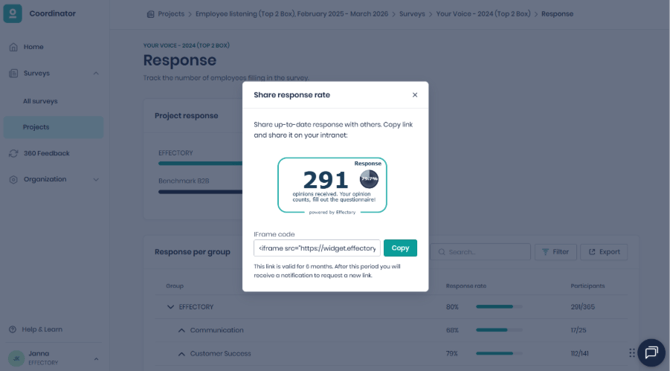
You can share a live response widget on your intranet or internal dashboards while a survey is running. To do so:
-
Open a survey and select View response.
-
In the Response card, select Share response rate.
-
Copy the link that appears.
-
Share or embed it wherever your organisation needs it.