This article is part of Effectory's resources on the results dashboard. For a video on how to use the dashboard, please refer to this article.
Are you using Top 2 Box? Please be informed that your scores will look different. For more information, please click here.
In the Scores tab you will find the scores of all the questions in your survey.
If you want to find out more about the interpreting of scores, please refer to this article: Results: Understanding and interpreting scores
This article contains:
- How to change the order of the scores
- How to dive deeper into each score
- How to choose a benchmark for comparison
- Segments
Change the order of the scores
By default, the questions are sorted by the order they appear in the survey. You can also choose to sort them by theme or by scores.

- Most increased/most decreased scores ranks the questions based on the most increased/decreased scores compared to the previous survey (If applicable).
- Positive/negative difference in group scores ranks the questions based on the magnitude of the positive/negative difference between your group's scores and those of the whole organization. The questions are ordered from the largest difference to the smallest difference.
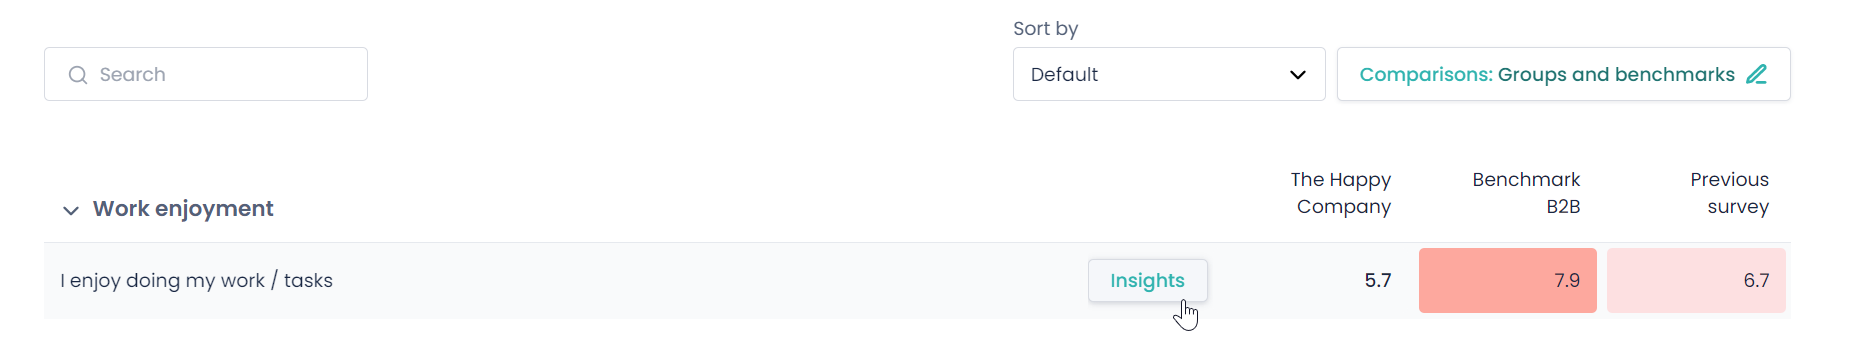
Dive deeper into each score
If you hover over a question, the Insights button appears. By clicking on it, you will see how this question was answered by all respondents as well as a trend analysis of previous surveys (if applicable).
To protect the respondent’s anonymity, the distribution of answers is visible:
- As a 5 point scale for groups larger than 50 respondents
- As a 3 point scale for groups between 5 and 50 respondents
Under the Tips & Best Practices tab, you will find tips and best practices related to this question.


Choose a benchmark for comparison
You can choose the benchmarks or comparison groups you want to compare these scores to.
Click on Comparisons: Groups and benchmarks to see higher-level comparisons. These are:
- The selected benchmark(s)
- The previous survey (if applicable)
- The parent-level group (the group one level above)
- The whole organization
Select Group level below to see lower-level comparisons. These are the groups on the level below.
Segments
Segments are a way to view survey results by specific groups of employees based on shared characteristics; for example Gender, Age and Tenure. For more about segments, please read this article: Understanding and using segments in My Effectory.
The results based on characteristics, can be found by clicking on Comparisons: Groups and benchmarks and clicking on the relevant segment (if available).
