Results dashboard: Overview
This article is part of Effectory's resources on the results dashboard. For a video on how to use the dashboard, please refer to this article.
Are you using Top 2 Box? Please be informed that your scores will look different. For more information, please click here.
This article contains:
- How to access the results dashboard
- The overview page
- AI Summary of themes
- The icons in each tile
- An explanation for each tile
Accessing the results dashboard
- Log into My Effectory.
- Go to the project in which the survey was launched.
- On the survey page, click on "View results"
> The results dashboard opens.
The overview page
- provides you with the main results in the blink of an eye
- is dynamic
- differs per survey, based on both questions and themes in your survey
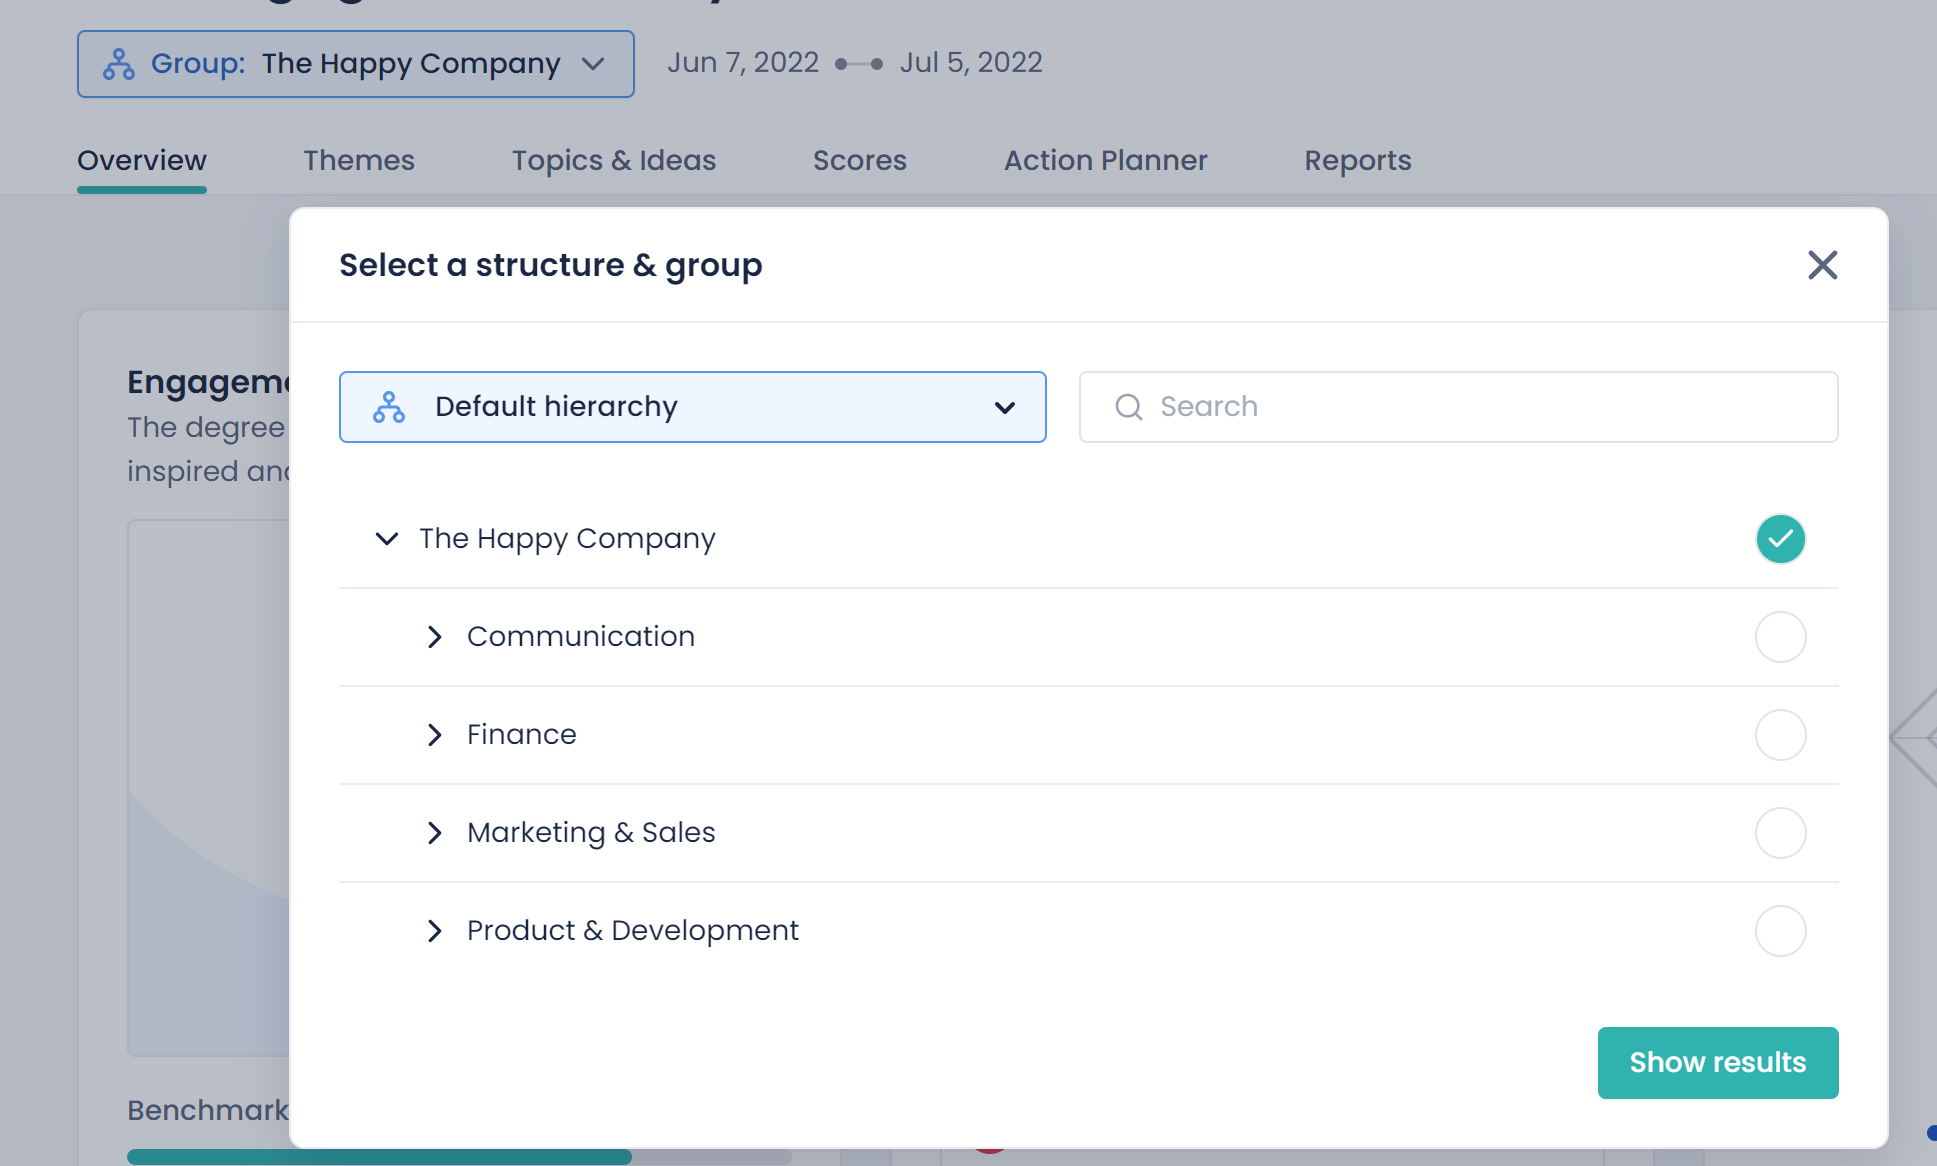
- can be adjusted in what insights it shows by using the navigation at the top:
AI Summary of the themes
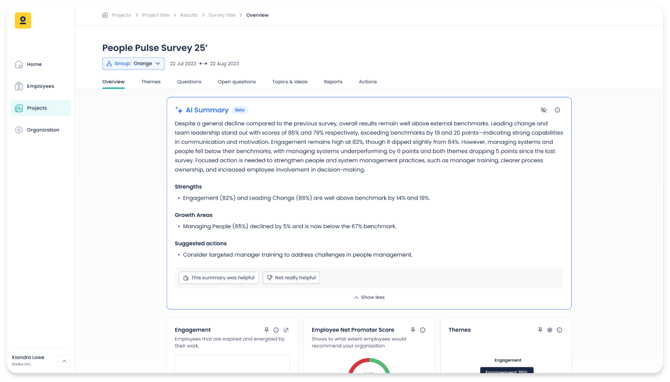
Note: Effectory’s AI Summary is developed with privacy and GDPR compliance, ensuring your data remains secure and confidential.
The icons in each tile
- Pin icon The pin icon allows users to pin interesting or relevant scores that can later be used to create an action plan.
- i-symbol By clicking on the information icon, you are provided with more in-depth information
- Arrow symbol This arrow indicates that there are correlating questions linked to a theme. By clicking on the arrow, you can find an overview of the correlating questions.
The tiles
Note: the overview page may differ per survey as it is based on questions asked and themes covered.
Effectiveness matrix
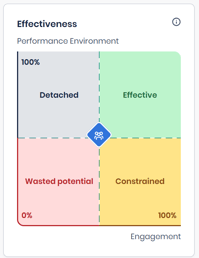
This matrix shows the performance environment of the respective team. A performance environment score shows how effective a group is in reaching their goals, staying innovative and dealing with change. By clicking on the tile, you receive more information on where you stand and what to focus on to further improve yourself as a team or group.
Engagement

- If you chose to compare the results to a previous measurement, the score on the bottom-right indicates the difference to (a) previous survey(s).
eNPS
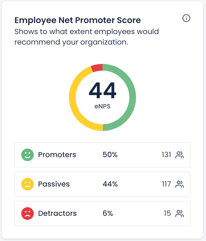 The Employee Net Promoter Score (eNPS) tile shows how your employees answered the question "How likely is it that you would recommend your organization as an employer to others?". It displays the overall eNPS score, as well as the percentage of respondents divided into three groups:
- promotors
- passives and
- detractors
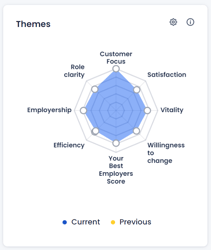 If your survey consists of 3 or more themes, the theme scores will be displayed on a web graph:
- Exact scores: You can see the exact scores by hovering above the data points with your mouse.
- Previous surveys: If your survey is compared to a previous survey, previous scores will also be shown as an overlaying web.
- (De-)select themes: By clicking on the gear icon, you can select the themes you want to visualize on the web.
Feel-good topics & Your employees' ideas
 This tile shows the answers to the questions:
- What are you most proud of in your organization? (feel-good topics)
- What needs improvement in your organization? (your employee's ideas).
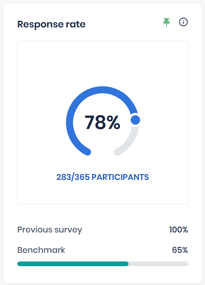 This tile shows the percentage of employees invited to the survey who have completed the survey. The tile also shows a comparison of your survey's response rate with the response rate of the benchmark and, if applicable, the response rate of the previous survey.
Highest & Lowest scores
 These two tiles show the specific survey questions that your group scored most positively on (Highest scores) or most negatively on (Lowest scores).
Retention
- When you click on the i-symbol, you can see how the answers are distributed amongst the respondents.
- When you click on the i-symbol, you can see how this question was answered by all of the respondents.
 If you participate at World-class Workplace, an additional tile will show you whether you have been awarded the label.
- By clicking on Download image, you can download the label for (internal) branding purposes.